
Assessments

Assessment science
VANT4GEPOINT

The Structure is the Story.

When someone sits down for an assessment, they are telling their story for the first time to a system that will use it to shape everything that follows. The science behind that instrument determines whether the system actually hears them. Vant4ge has spent 28 years building assessment science: the methodology, the research, and the peer-reviewed rigor that makes that moment count.

The Static Risk and Offender Needs Guide-Revised (STRONG-R) is the result. A tool and a methodology, it is the most predictive, locally validated, and bias-mitigated risk and needs assessment ever developed in corrections.

PRODUCT HIGHLIGHTS

STRONG-R Methodology

Locally Validated

An instrument applied outside the population it was built for loses predictive accuracy. That is Predictive Shrinkage, and every off-the-shelf assessment experiences it.

The Number that Decides

AUC scores above .72 across every validated STRONG-R deployment. That threshold defines large-effect predictive validity. Most off-the-shelf instruments never reach it.

Keep Accuracy. Remove Bias

The STRONG-R is the first tool to measurably reduce racial and gender bias. 383 model iterations. Published methodology. Replicable results.

assessment science

28 Years of Asking the Right Questions the Right Way.

Assessment Science is a rigorous discipline to which Vant4ge adheres to construct every localized tool. It requires sustained expertise in instrument development, statistical modeling, local validation, and ongoing re-calibration as population data changes. Vant4ge has been developing it since 1998. The STRONG-R is the result: a peer-reviewed risk and needs assessment tool structured around Andrews and Bonta’s Criminogenic Risk Needs, and developed through a multivariate item selection and weighting methodology that identifies the combination of factors most predictive of recidivism for a specific population, in a specific jurisdiction, under specific conditions.

That is what assessment science looks like when it is done correctly.

Predictive validity

Above 0.71.
In every implementation.

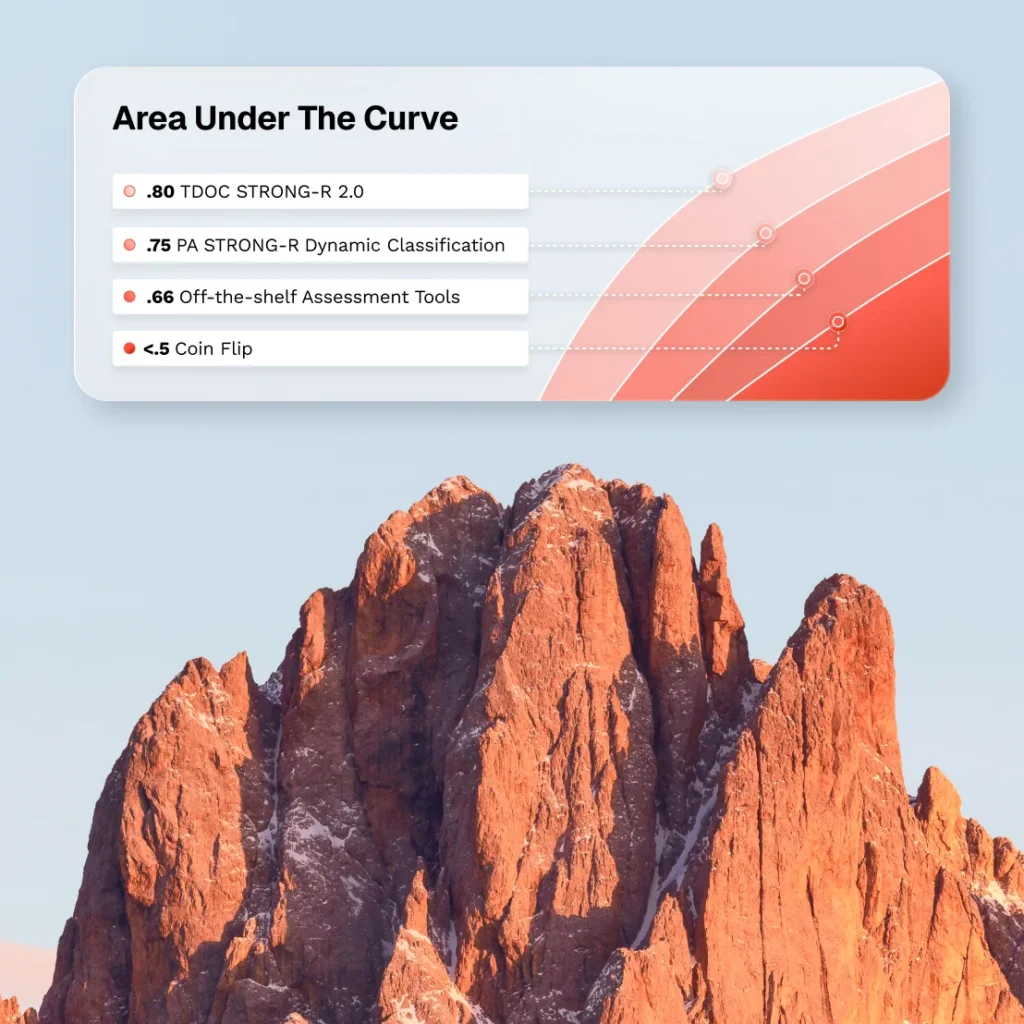
The Area Under the Curve (AUC) is the industry standard for measuring how accurately a risk assessment predicts recidivism. It ranges from .50, which is no better than a coin toss, to 1.00, which is perfect prediction. Effect sizes below .56 are negligible. Between .56 and .71 is small to moderate. Above .71 is large.

Most off-the-shelf assessments produce scores in the small-to-moderate range because they were not built for the population they are scoring. STRONG-R AUC scores across every validated deployments range from .72 to .80, all in the large-effect range. 

Graphic, Area Under the Curve: Current STRONG-R deployments vs. Off-the-shelf Assessment Tools.

predictive shrinkage

If the Population Changes, so must the Instrument.

Local conditions shape local behavior in ways a borrowed instrument cannot account for. You would not drive on the right side of the road in England. The rules changed, so the instrument has to change with them. AUC performance that scored well in its original deployment drops measurably when applied to a different population. Agencies running off-the-shelf assessments experience predictive shrinkage whether they know it or not.

The STRONG-R addresses this by design. Every implementation begins with the agency’s own data and produces an instrument calibrated to the specific population it will score. Local validation is the only way to ensure the instrument performs the way the research demonstrates.

Bias mitigation

Proven in PA DOC,
Available to You.

In Pennsylvania, Vant4ge built the first risk and needs assessment to demonstrate measurable mitigation of racial bias through peer-reviewed research. Developed through 383 model iterations in active research partnership with PA DOC researchers, the instrument was built to identify and address the statistical patterns that produce disparate risk scores across racial and gender groups. The methodology is published. The results are replicable.

Every STRONG-R implementation carries the same commitment: the instrument is validated for the population it scores, and the scoring logic is tested against its own bias. That is what it means to build the science correctly.

Assessment science

The Science Behind the Score.

In Tennessee, after three years the STRONG-R saw recidivism rates fall from 40.8% to 27%. That is the lowest figure in the state’s recorded history. The instrument produced that improvement because it was built on local data, validated against local outcomes, and recalibrated as those outcomes changed. That is Assessment Science. That is what Vant4ge has been building for 28 years.

Common Questions

The shorter version of a longer conversation.

The Static Risk and Offender Needs Guide-Revised (STRONG-R) is a peer-reviewed risk and needs tool developed by Vant4ge, and the methodology behind it: multivariate item selection and weighting applied to an agency’s own population to identify the combination of factors most predictive of recidivism for that specific population and jurisdiction. It draws from a pool of 130 unique items structured around Andrews and Bonta’s Central Eight Criminogenic Risk Needs. It is locally validated, bias-mitigated, and the first tool of its kind to demonstrate measurable mitigation of racial and gender bias in corrections risk scoring through published peer-reviewed research.

AUC, or Area Under the Curve, is the industry standard for measuring how accurately a risk assessment predicts recidivism. Scores range from .50, no better than a coin toss, to 1.00, perfect prediction. Effect sizes are categorized as negligible below .56, small to moderate between .56 and .71, and large above .71. STRONG-R deployments have consistently produced AUC scores in the large-effect range across every validated implementation. Most off-the-shelf assessments produce small-to-moderate scores because they are applied outside the population they were built for.

Predictive shrinkage is the well-documented accuracy loss that occurs when a validated assessment is applied to a population it was not built for. An instrument that performed well in its original validation study will lose predictive accuracy when deployed in a jurisdiction with different population characteristics. The STRONG-R addresses this through local model development: every implementation begins with the agency’s own population data and proceeds through iterative model development and validation before deployment. The instrument does not shrink in deployment because it was built for that deployment.

Vant4gePoint administers, scores, routes, and stores results from any validated risk and needs tool an agency requires, including the STRONG-R, M-PACT, and any additional tool an agency has built its practice around. Agencies are not required to adopt Vant4ge’s own instruments to deploy the platform. For agencies that do run the STRONG-R, assessment results flow directly into Vant4gePoint’s Case Planning Module, where domain-based needs scores surface in priority order and drive goal and program referral recommendations for the officer’s review.

Our solutions

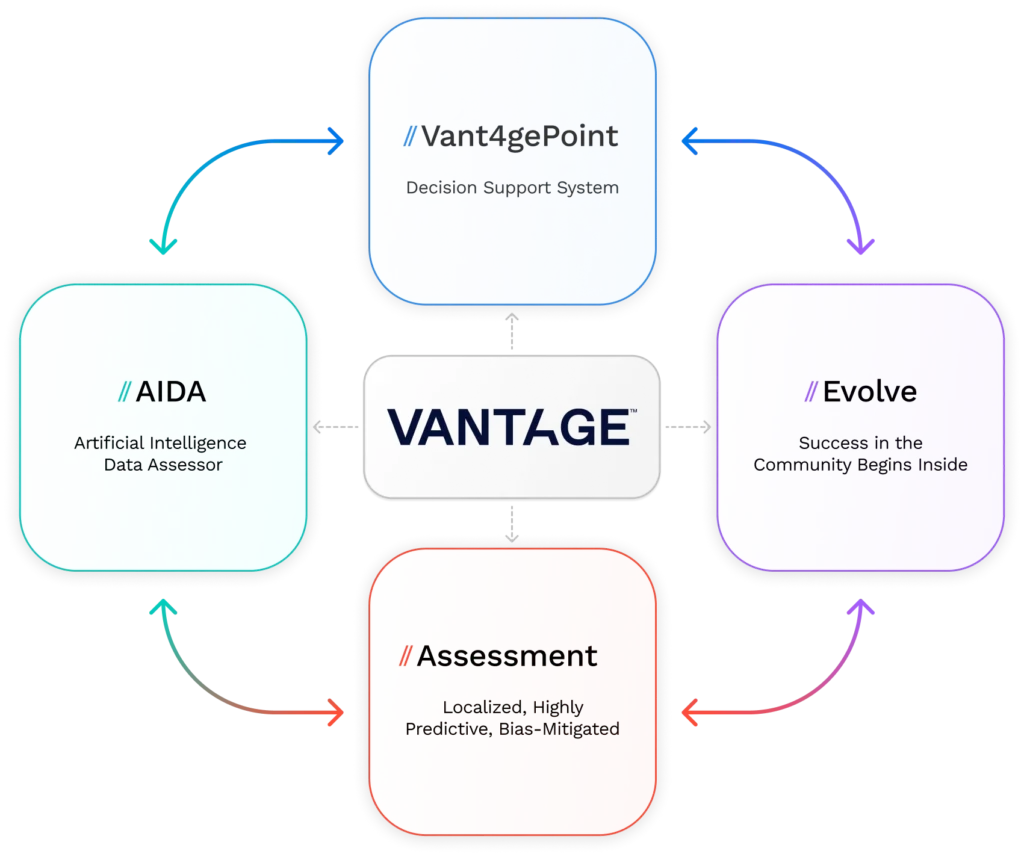
One Platform. Four Products. Endless Iterations